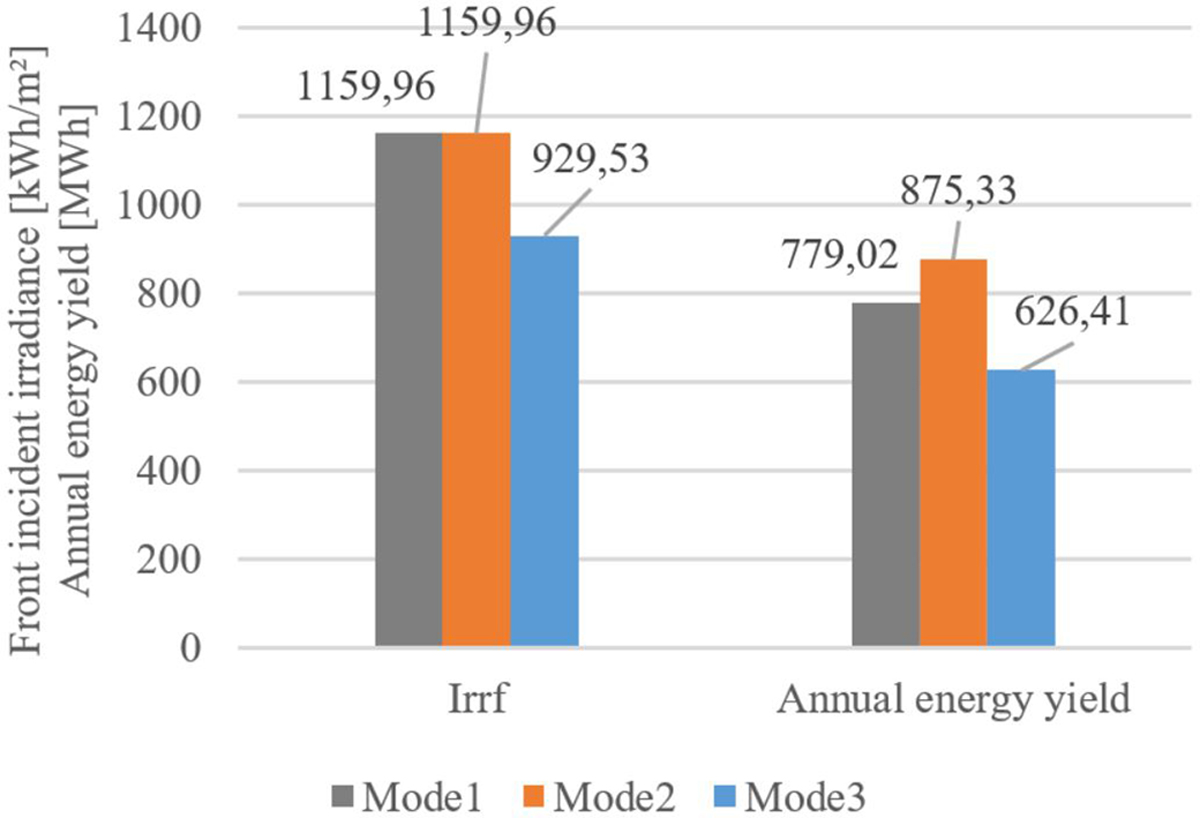
Fig. 5
Download original image
The figure illustrates front irradiance and annual energy yield for simulations on plant Germany. Comparisons to the measured front irradiance and energy yield can be made, but exact values cannot be disclosed in this article. The simulated values of modes 1 and 2 are identical due to being calculated using VF and both are close to the measured front irradiance. mode 3 with RT based calculations shows a larger deviation. For the energy yield, mode 1 is closest to the measured data, whereas mode 3 shows a significant negative deviation to the real data.
Current usage metrics show cumulative count of Article Views (full-text article views including HTML views, PDF and ePub downloads, according to the available data) and Abstracts Views on Vision4Press platform.
Data correspond to usage on the plateform after 2015. The current usage metrics is available 48-96 hours after online publication and is updated daily on week days.
Initial download of the metrics may take a while.