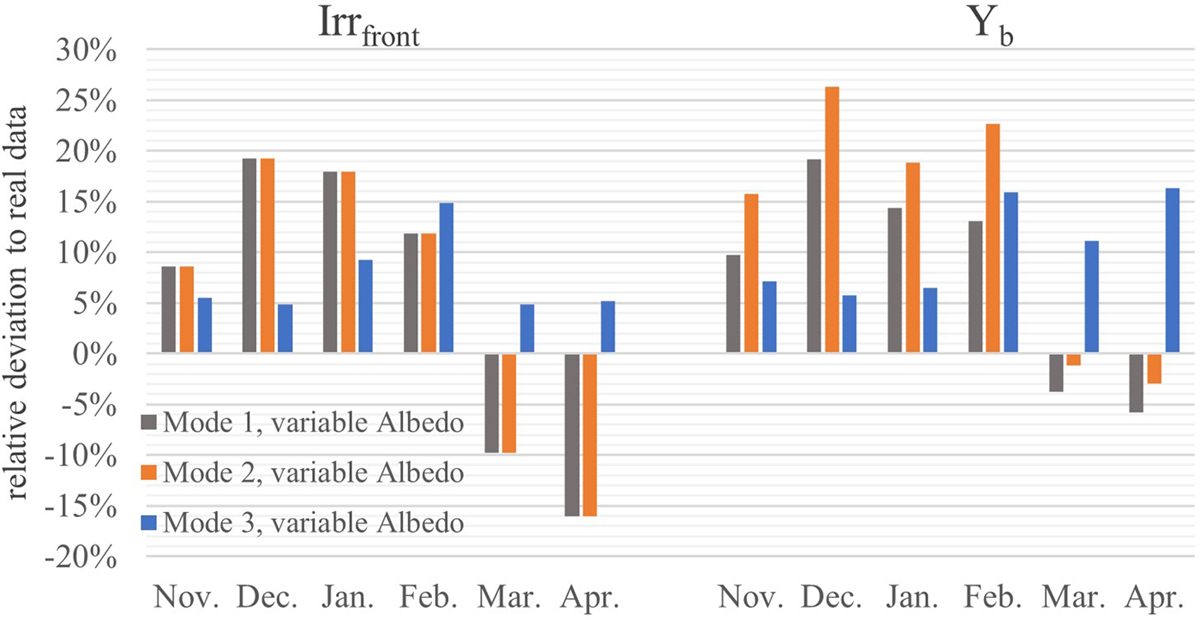
Fig. 3
Download original image
This figure represents the simulation data using a variable albedo. The data shows a similar behaviour to the simulation using a fixed albedo. The deviation between variable albedo and fixed albedo is strongest in February, where mode 1 deviates 12% from the real data, whereas constant albedo only shows a 8% difference. This maximum deviation is also transferred over to the energy yield, where the delta is 10% between the 3% and 13% deviation to measurement data for fixed and variable albedo respectively. The deviation for front irradiance simulation using variable albedo is smaller in other months, with negatives cancelling out positive values over the simulation time-frame, resulting in an average deviation of 0.9% for mode 1.
Current usage metrics show cumulative count of Article Views (full-text article views including HTML views, PDF and ePub downloads, according to the available data) and Abstracts Views on Vision4Press platform.
Data correspond to usage on the plateform after 2015. The current usage metrics is available 48-96 hours after online publication and is updated daily on week days.
Initial download of the metrics may take a while.