Fig. 2
Download original image
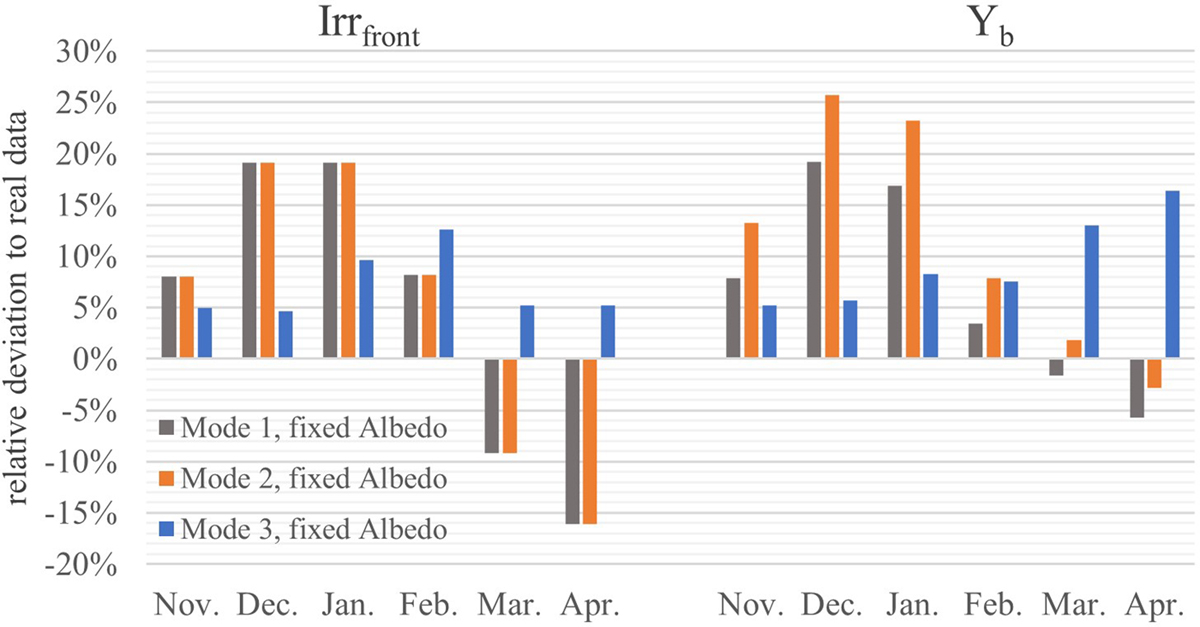
The figure shows the relative deviation between simulation data and measured data of the front irradiance Irrfront and the area-specific energy yield Yb in the time frame of November 2019 to April 2020. Mode 1 and 2, which use VF for front side irradiance calculation, show the same results for Irrfront. The largest positive deviation is 19% in December and the largest negative difference is −16% in April. Mode 3, which uses RT, shows only positive deviations. The front irradiance deviations also translate over to the energy yield Yb. Here mode 2, which uses only VF, calculates the highest deviations between simulation and measured data. The influence of RT for the calculation of the rear irradiance can be seen in the lower deviations of mode 1. The pure RT simulation mode 3 only produces positive deviations, which are highest in April with 16%.
Current usage metrics show cumulative count of Article Views (full-text article views including HTML views, PDF and ePub downloads, according to the available data) and Abstracts Views on Vision4Press platform.
Data correspond to usage on the plateform after 2015. The current usage metrics is available 48-96 hours after online publication and is updated daily on week days.
Initial download of the metrics may take a while.