Fig. 4

Download original image
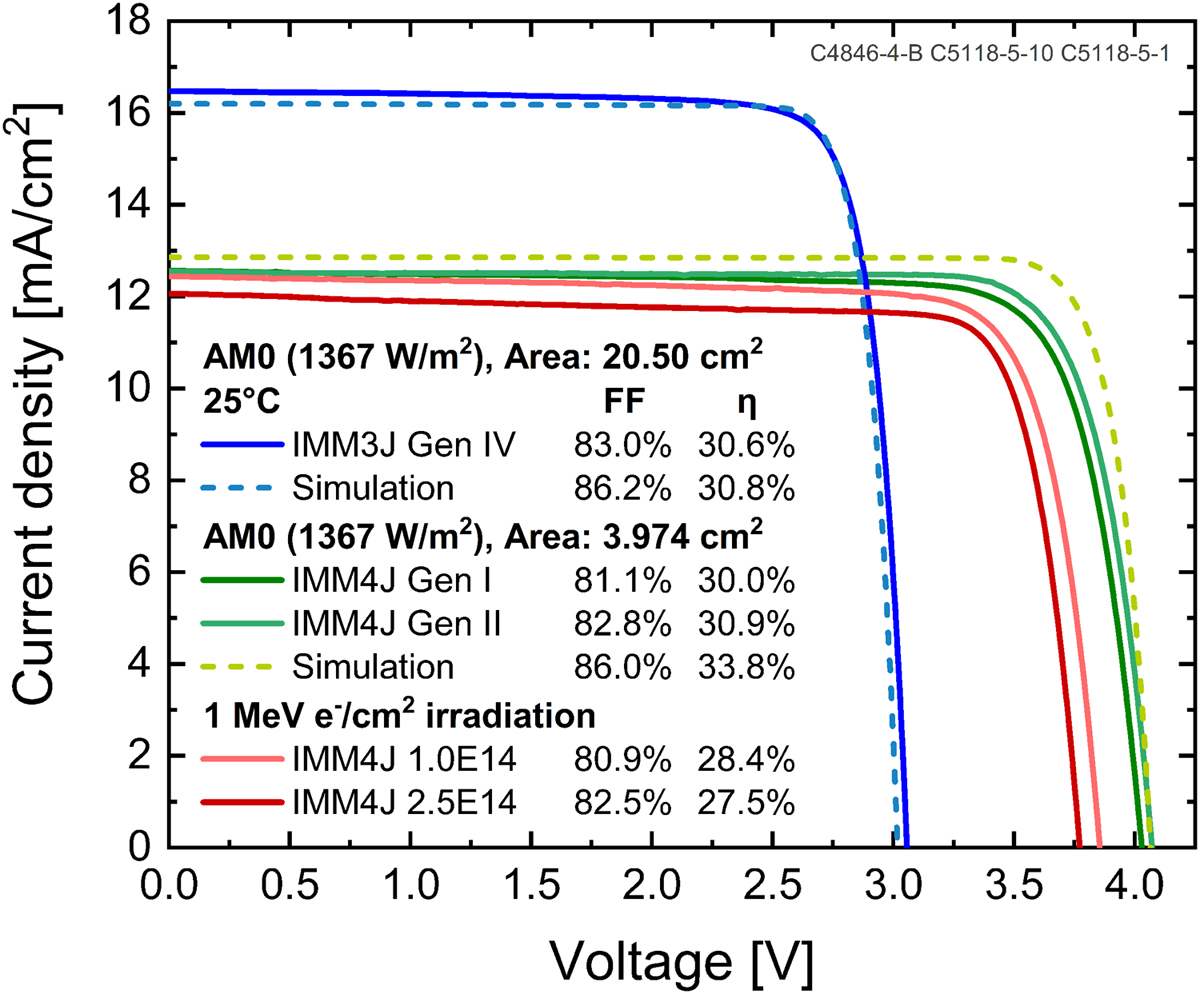
Light IV curves for the first two generations of IMM4J solar cells in BOL condition (solid green). The light IV curve for the last generation of IMM3J in BOL condition is shown for comparison (solid blue). The simulated realistic potential IV curves for both devices are shown as dashed lines. IV curves of the best cells after 1 MeV electron irradiation with a fluence of 1 × 10¹⁴ e–/cm2 and 2.5 × 10¹⁴ e–/cm2 are shown in solid pink and red respectively.
Current usage metrics show cumulative count of Article Views (full-text article views including HTML views, PDF and ePub downloads, according to the available data) and Abstracts Views on Vision4Press platform.
Data correspond to usage on the plateform after 2015. The current usage metrics is available 48-96 hours after online publication and is updated daily on week days.
Initial download of the metrics may take a while.


