Fig. 2
Download original image
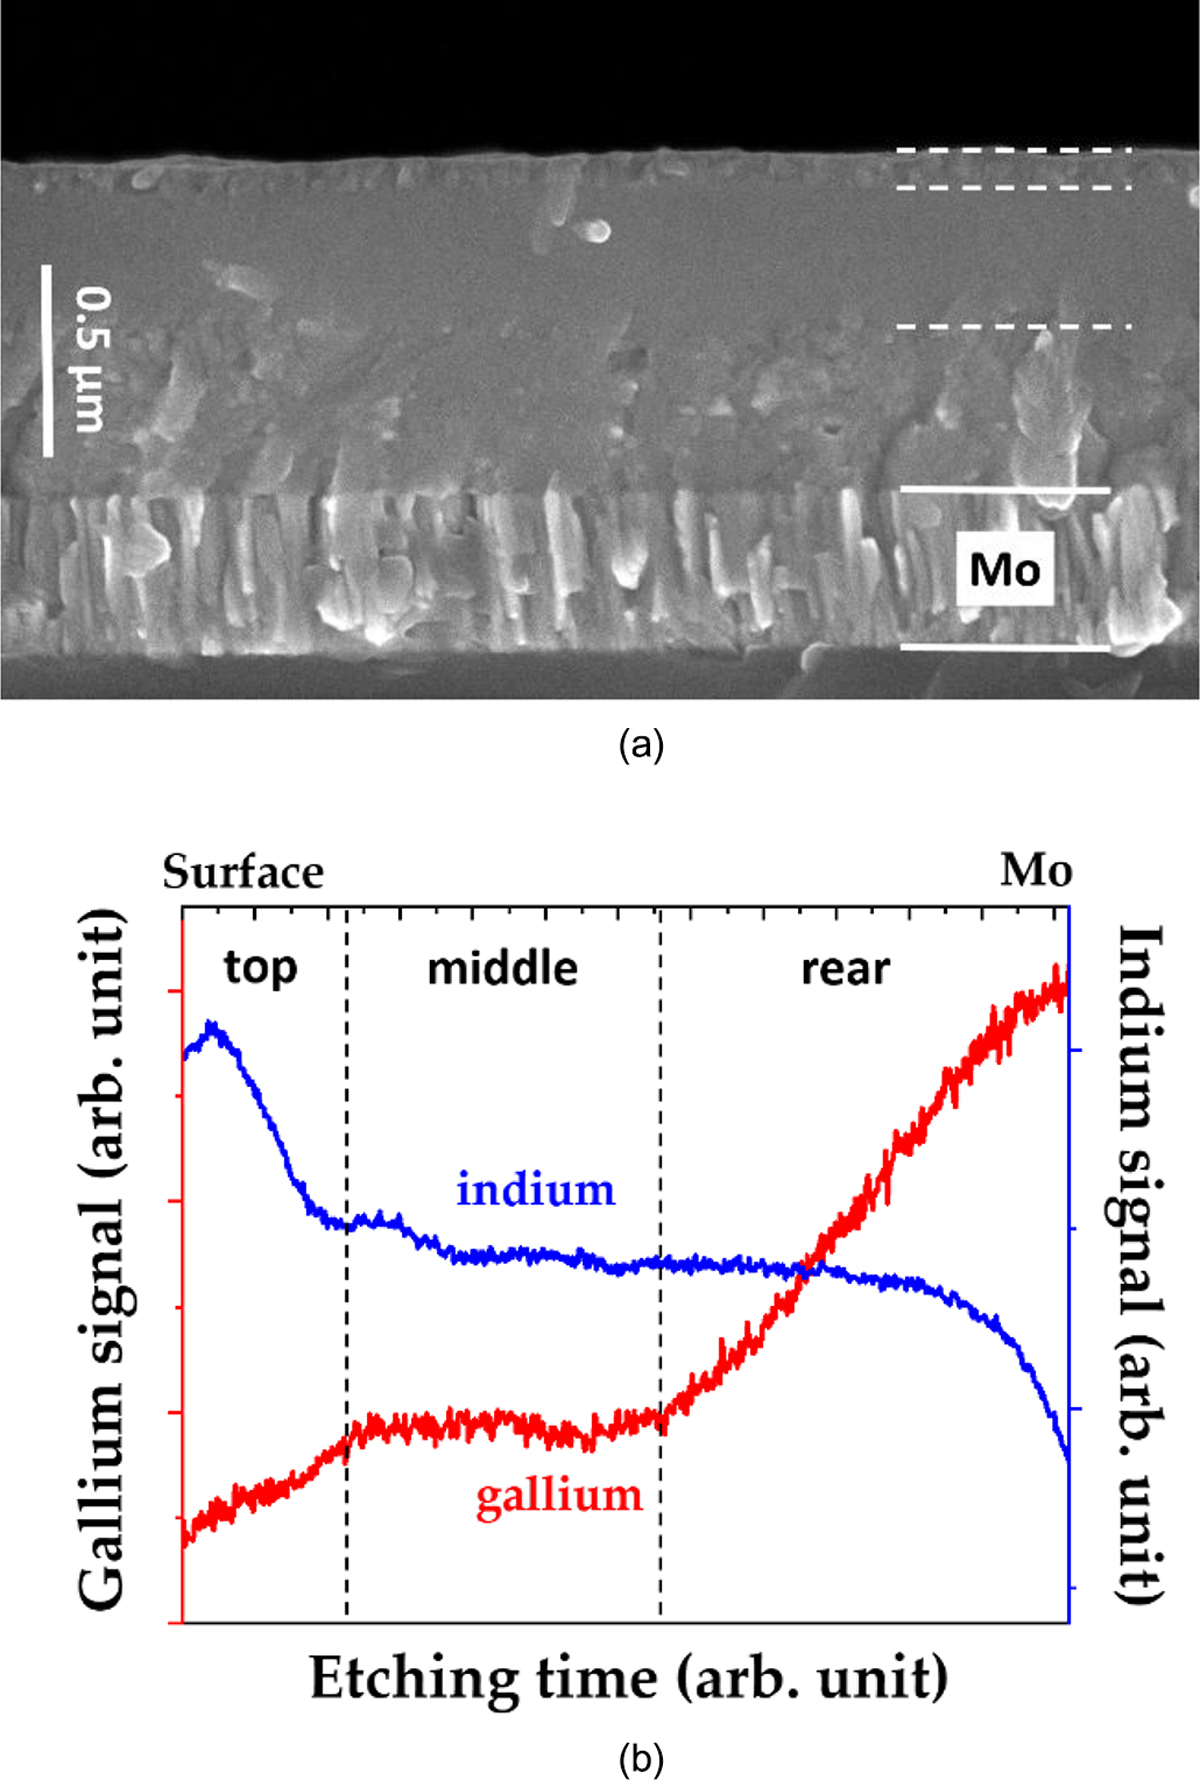
a: Scanning electron microscope image of the cross section of the film at the end of the first stage. This image shows the morphological layered structure of the film at the end of the first stage. 2b: Qualitative profiles of gallium (in red) and indium (in blue) measured by glow discharge optical emission spectrometry throughout a film at the end of the first stage. This plot shows three different zones corresponding to the layers observed by SEM.
Current usage metrics show cumulative count of Article Views (full-text article views including HTML views, PDF and ePub downloads, according to the available data) and Abstracts Views on Vision4Press platform.
Data correspond to usage on the plateform after 2015. The current usage metrics is available 48-96 hours after online publication and is updated daily on week days.
Initial download of the metrics may take a while.