Fig. 2
Download original image
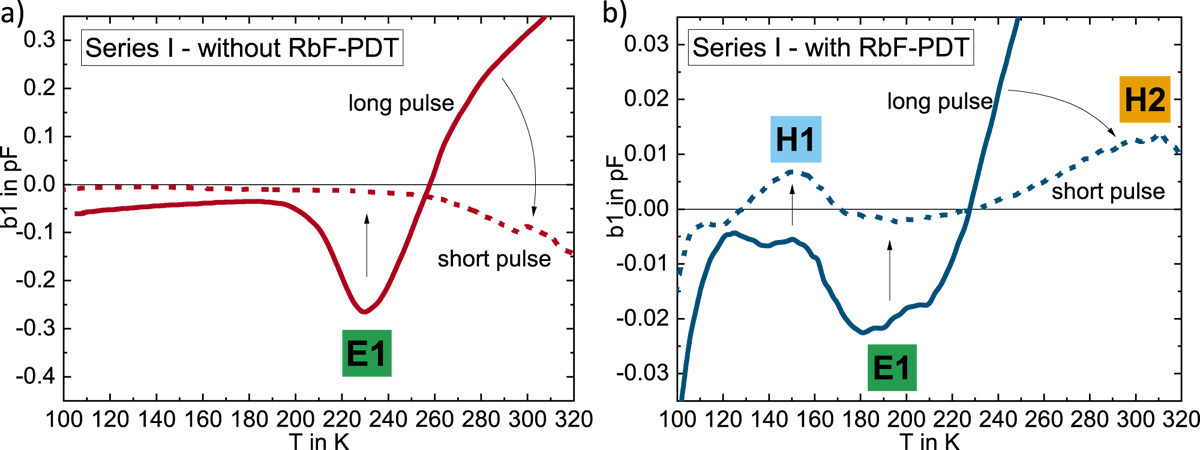
Comparison of DLTS measurements on CIGS samples from Series I (a) without and (b) with PDT. Solid lines represent measurements with 50 ms filling pulse, dashed lines with 1 ms. Different pulse widths enable the observation of different traps. For tw a value of 10 ms was used.
Current usage metrics show cumulative count of Article Views (full-text article views including HTML views, PDF and ePub downloads, according to the available data) and Abstracts Views on Vision4Press platform.
Data correspond to usage on the plateform after 2015. The current usage metrics is available 48-96 hours after online publication and is updated daily on week days.
Initial download of the metrics may take a while.