Fig. 3
Download original image
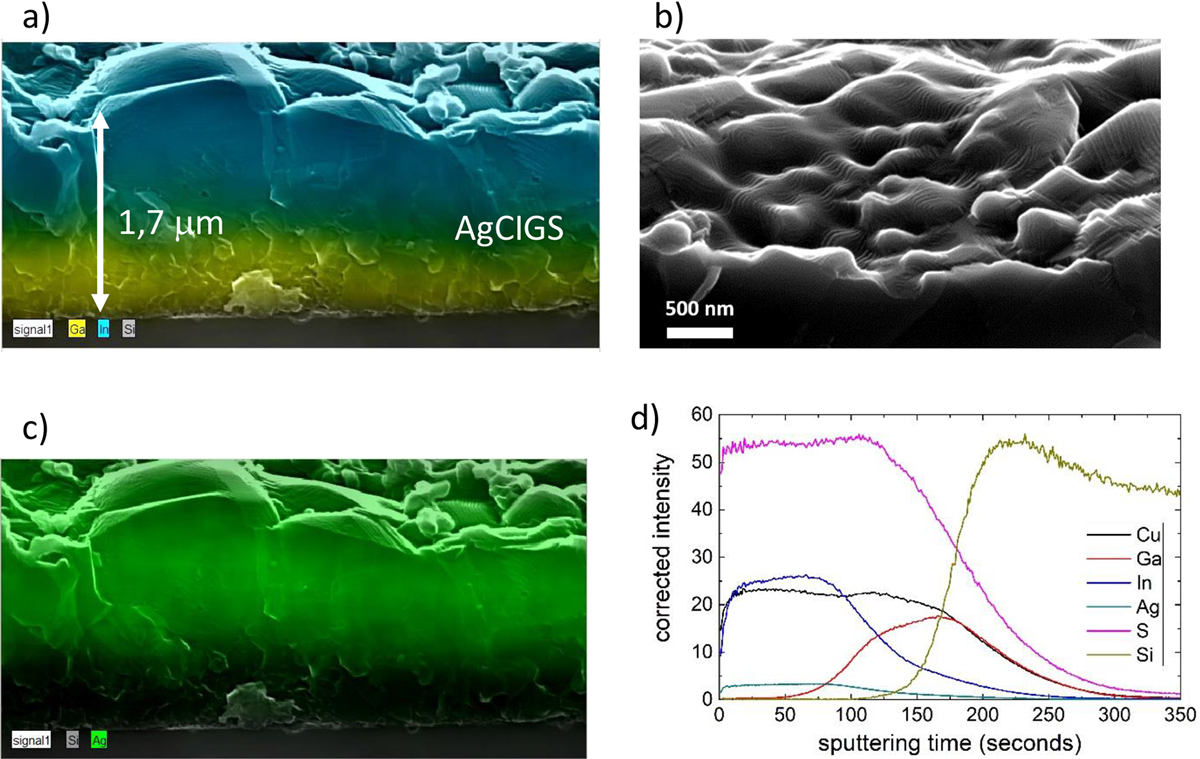
(a) SEM cross section colorized with EDX intensities of In in blue and Ga in yellow, (b) SEM top view tilted, (c) SEM cross section image colorized with EDX intensity of Ag in green, (d) GDOES analysis of AgCIGSu on silicon. Raw intensities are corrected as described in the experimental section to give an estimation of atomic percentages in the AgCIGS film.
Current usage metrics show cumulative count of Article Views (full-text article views including HTML views, PDF and ePub downloads, according to the available data) and Abstracts Views on Vision4Press platform.
Data correspond to usage on the plateform after 2015. The current usage metrics is available 48-96 hours after online publication and is updated daily on week days.
Initial download of the metrics may take a while.