Fig. 4
Download original image
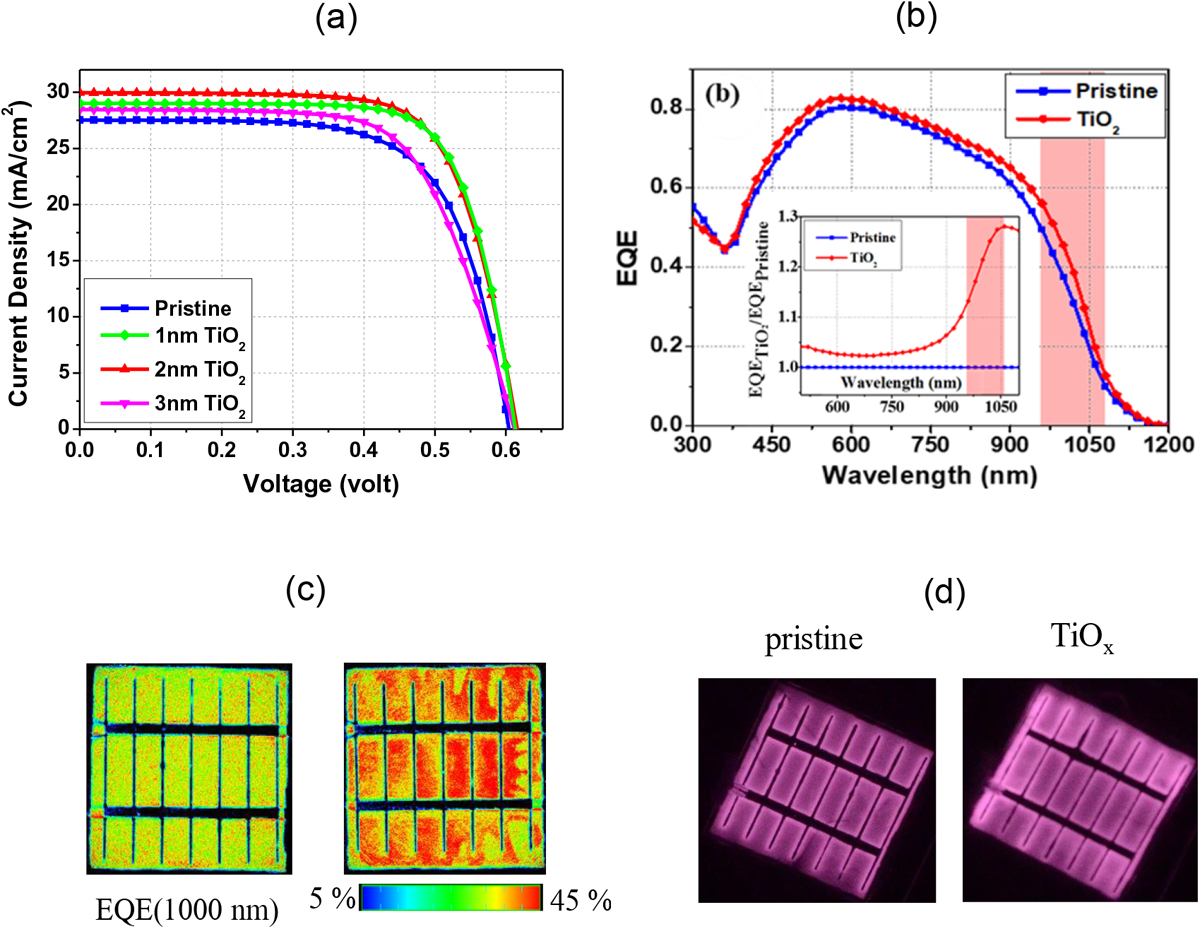
(a) J–V curve of PEDOT:PSS/n-Si solar cells TiO2 HBLs with different layer thicknesses. (b) EQE for devices with and without a 2-nm-thick TiO2 HBLs. The inset shows EQETiO2/EQEpristine. (c) 2D map of EQE at 1000 nm and (d) far-infrared EL emission images for devices with and without a 2-nm-thick TiO2 HBL.
Current usage metrics show cumulative count of Article Views (full-text article views including HTML views, PDF and ePub downloads, according to the available data) and Abstracts Views on Vision4Press platform.
Data correspond to usage on the plateform after 2015. The current usage metrics is available 48-96 hours after online publication and is updated daily on week days.
Initial download of the metrics may take a while.