Fig. 5
Download original image
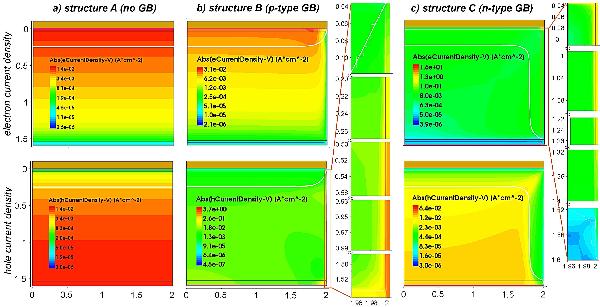
Exemplary 2D simulations of the electron and hole current density distributions in the cell at short circuit conditions for (a) structure A, (b) structure B and (c) structure C. The GB doping concentration is and the GB defect density . The boundary of the space charge region is marked with a white line. The zoom-in into the GB layer shows the extremely high majority-carrier current in the GB increasing towards the respective majority carrier contacts.
Current usage metrics show cumulative count of Article Views (full-text article views including HTML views, PDF and ePub downloads, according to the available data) and Abstracts Views on Vision4Press platform.
Data correspond to usage on the plateform after 2015. The current usage metrics is available 48-96 hours after online publication and is updated daily on week days.
Initial download of the metrics may take a while.