Fig. 4
Download original image
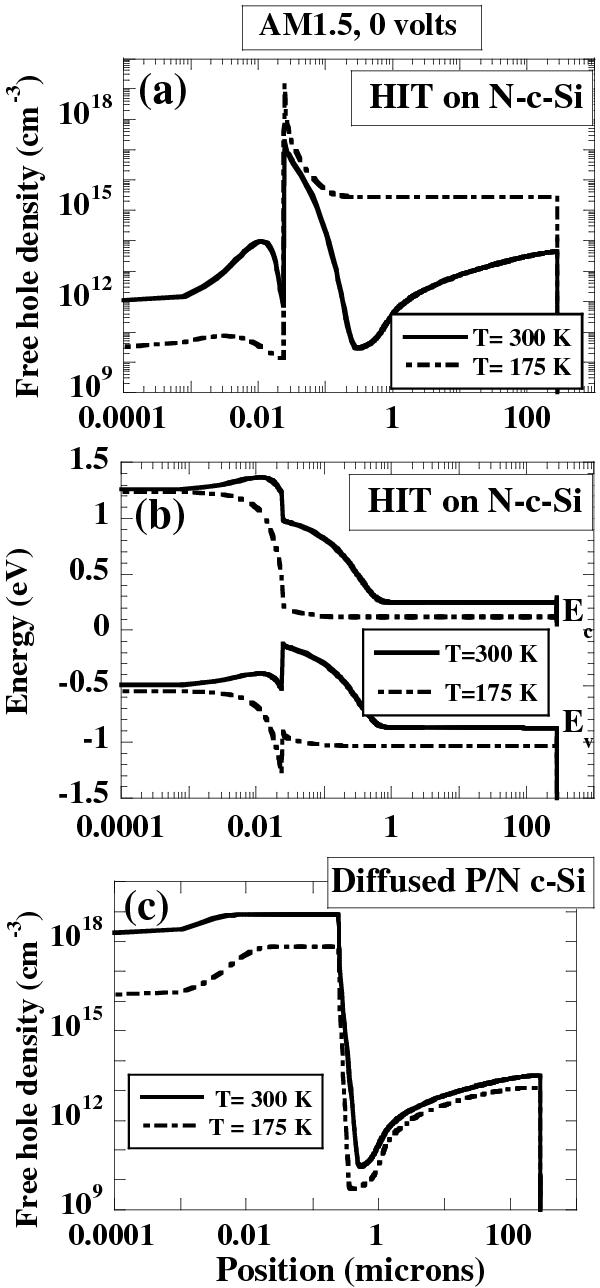
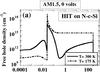
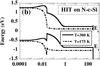
(a) The free hole density as a function of position in the device and (b) the band diagram, under AM1.5 light and short-circuit conditions, for a HIT cell on N-type c-Si wafer at 300 K and 175 K, showing hole accumulation and virtual disappearance of the depletion region on the c-Si side of the amorphous-crystalline interface at 175 K; (c) the free hole density as a function of position under the same conditions and at the same temperatures for a standard P/N homo-junction c-Si solar cell.
Current usage metrics show cumulative count of Article Views (full-text article views including HTML views, PDF and ePub downloads, according to the available data) and Abstracts Views on Vision4Press platform.
Data correspond to usage on the plateform after 2015. The current usage metrics is available 48-96 hours after online publication and is updated daily on week days.
Initial download of the metrics may take a while.