| Issue |
EPJ Photovolt.
Volume 14, 2023
Special Issue on ‘Recent Advances in Photovoltaics 2022’, edited by Mohamed Amara, Thomas Fix, Jean-Paul Kleider, Judikaël Le Rouzo and Denis Mencaraglia
|
|
|---|---|---|
| Article Number | 35 | |
| Number of page(s) | 13 | |
| Section | Modules and Systems | |
| DOI | https://doi.org/10.1051/epjpv/2023022 | |
| Published online | 30 November 2023 | |
https://doi.org/10.1051/epjpv/2023022
Regular Article
Control strategy for a dual-axis sun tracker based on a radiometric cube to maximize the power output of the PV system
1
Université Paris-Saclay, CentraleSupélec, CNRS, Laboratoire de Génie Électrique et Électronique de Paris, 91192 Gif-sur-Yvette, France
2
Sorbonne Université, CNRS, Laboratoire de Génie Électrique et Électronique de Paris, 75252 Paris, France
3
CNRS, LISN, Bâtiment 507, Rue du Belvédère, 91405 Orsay, France
4
École Polytechnique, Institut Pierre-Simon Laplace (IPSL), IP Paris, Ecole Normale Supérieure (ENS), Sorbonne Université, CNRS, Laboratoire de Météorologie Dynamique (LMD), 91120 Palaiseau, France
* e-mail: This email address is being protected from spambots. You need JavaScript enabled to view it.
Received:
3
March
2023
Received in final form:
3
August
2023
Accepted:
11
September
2023
Published online: 30 November 2023
Abstract
The use of solar energy as an energy source is essential to reduce greenhouse gas emissions. In a photovoltaic system, the use of a sun tracker can produce up to 40% more energy than a fixed system. However, it is important, especially in temperate climates, to have an effective control strategy that can adapt the movement of the solar tracker for all weather conditions. This work presents a new control strategy for a dual-axis sun tracker based on a radiometric cube with four photodiode sensors on its East, West, South and Zenith faces. The optimal direction that maximises the irradiance received by the sun tracker can be determined through the mathematical expression of the irradiances on the four faces of the cube, considering an isotropic model for the diffuse luminance of the sky. This new control strategy adjusts the movement of the solar tracker to an optimal position in all weather conditions. The proposed control strategy provides a 40.5% gain in energy output on a cloudy day compared to the standard chronometric sun tracking strategy. For periods of clear and highly variable sky, the difference between the two strategies is only 0.15% and 1%.
Key words: Solar tracking / control algorithm / photovoltaic / radiometric cube
© M.H. Andriamahefa et al., Published by EDP Sciences, 2023
 This is an Open Access article distributed under the terms of the Creative Commons Attribution License (https://creativecommons.org/licenses/by/4.0), which permits unrestricted use, distribution, and reproduction in any medium, provided the original work is properly cited.
1 Introduction
It goes without saying that climate change is the main cause of concern about survival on Earth. The Earth has already warmed by 1.1 °C during the decade 2011–2020 compared to the pre-industrial era [1]. In order to avoid the severe consequences of global warming and thus limit the increase in temperature to less than 2 °C, the use of renewable energy as energy source is fundamental [2]. In its third report [3], the Intergovernmental Panel on Climate Change (IPCC) states that photovoltaics is one of the sectors with the greatest potential to contribute to the reduction of greenhouse gases. Therefore, improving the efficiency of a photovoltaic system, and thus saving materials and space to produce the required amount of energy, simultaneously meets the energy needs of our society and makes an important contribution to environmental protection. In a photovoltaic system, good orientation and inclination of the PV modules allows a larger amount of solar radiation to be received per unit area, thus allowing the PV module to produce a greater amount of electrical energy. Solar tracking systems have therefore been developed with the aim of maximising the energy produced by a photovoltaic installation by constantly orienting the PV modules in the direction of maximum radiation. In the absence of clouds, they also allow for a power output close to the installed power for a longer period each day.
Solar trackers can be classified according to their number of degrees of freedom. A solar tracker can be a single-axis system, where the PV modules can only rotate around one axis. The second category is a two-axis system with two degrees of freedom. There are also other types of solar trackers with multiple axes [4]. A photovoltaic (PV) module on a solar tracker can produce up to 40% more energy than a fixed PV module [5]. An important issue for a solar tracker is the strategy used to control its movement. An inadequate control strategy can lead to a loss of solar energy production, premature wear of solar tracker components, and increased maintenance costs. An effective control strategy is therefore essential for the solar tracker to maximise solar energy production and ensure good performance.
Various control strategies exist for a solar tracker. Generally, the standard control strategy used is a chronometric sun tracking. In this control strategy, the solar tracker is positioned perpendicular to the direction of the centre of the disc of the sun and follows the sun constantly to take advantage of the direct radiation from the sun. This strategy calculates the position of the sun using the geographical location of the site (i.e., latitude and longitude), the exact time and date, and then determines the orientation of the tracker to face the sun [6]. This strategy is the easiest to implement and allows the solar tracker to follow the sun regardless of weather conditions. This control strategy does not use sensors, which means that it does not receive feedback on the position of the sun or the direction that maximises solar irradiation. Eke et al. [7] analysed the annual performance of a two-axis solar tracker which uses a chronometric sun tracking versus a fixed PV system with an optimum tilt for the location where their experiment was carried out. Their research revealed that the chronometric sun tracker generated 30.79% more energy than the fixed PV system. However, the main inconvenience of the chronometric sun tracking is that the position set for the sun tracker is not optimal during cloudy periods. In fact, when the sun is covered by clouds, the direction to receive the maximum irradiance is not necessarily towards the sun. In these weather conditions, it is also necessary to take advantage of the irradiance diffused by the sky vault.
Other studies [8–10] use a control strategy called closed loop, which is based on sensor feedback to direct the tracker to the position that maximises solar irradiance. The review of control algorithms implemented in solar tracking systems presented in [11] revealed that the closed-loop algorithm is the most widely used. Fathabadi et al. [12] proposed a sensorless closed-loop strategy based on feedback of the power at the maximum power point tracking to detect the direction of the tracker in which the maximum output power is produced. This strategy can increase the energy produced by a PV system by 28.8–43.6% compared to a fixed PV system, depending on the seasons. Nevertheless, the first inconvenience of the closed loop strategy is that in a situation with a strong variation of weather conditions, the solar tracker could oscillate continuously without stabilising in the optimal direction. The second inconvenience is that the algorithm depends on the movement of the tracker at the previous moment, and if the direction towards the maximum irradiance is not in the field of view of the photovoltaic modules, the tracker could be trapped in a local maximum irradiance zone. The study in [13] proposed a hybrid control strategy based on real-time image processing and photosensors to control a two-axis sun tracker. A camera is used to detect the position of the contour of the sun and feedback from 5 photosensors is used to adjust the command to track the sun. This control strategy was applied to an active daylighting system. A system like this requires the use of image processing, which needs to be quite fast and accurate to maximise the power produced by a PV system.
The study in [14] proposed a control strategy from an independent robotic sensor system for a two-axis solar tracker. The robotic sensor system first locates and then provides the reference trajectory to orient the solar tracker. The two-axis solar tracker driven by a robotic sensor achieved a better performance than fixed PV system, as well as the one axis solar tracker, especially under irregular cloudy conditions. However, this system has a higher risk of failure, requires additional maintenance costs and consumes slightly more energy for the robotic sensor actuators to search for the optimal direction.
This paper presents a new control strategy based on a radiometric cube for a two-axis sun tracker. The control is not dependent on the movement of the tracker. The radiometric cube is mounted on a fixed support independent of the tracker. By measuring the irradiance on four sides of the radiometric cube, the solar tracker can be directed in an optimal direction that maximises the irradiance per unit area on the sun tracker. Indeed, the mathematical expression of the irradiances on the four faces of the cube can be used to determine the direction of the optimal position. This new strategy enables the sun tracker to adjust its position in a cloudy period to take advantage of the irradiance scattered by the sky vault. In addition, this system is simple to implement and does not require additional energy consumption, it measures the direct and diffuse components of solar radiation as well as the direction of the sun and thus allows the photovoltaic efficiency of the modules to be evaluated.
The first prototype of the radiometric cube is presented in this paper. The proposed control strategy is compared experimentally with a standard chronometric sun tracking control on a two-axis sun tracker. Section 2 of this paper presents the description of the two-axis sun tracker used, the description of the radiometric cube, and the acquisition systems. Section 3 contains an explanation on how to determine the optimal direction from the irradiance of the four sides of the radiometric cube. The results of the comparison between the control strategy based on the radiometric cube and the standard chronometric tracking are presented in Section 4.
2 Description of the system
This section gives a description of the two identical solar trackers used to make a comparison of the proposed control strategy with standard chronometric solar tracking. This comparison was done by quasi-simultaneous measurements of the maximum power points of two identical PV modules installed on the two trackers. A description of the radiometric cube is also given.
The whole system can be divided into two blocks:
Block 1: solar tracking system that automatically orients the PV modules to the optimal direction.
Block 2: radiometric cube system, a fixed system independent of the solar tracker. This block determines the optimal orientation of the solar tracker in real time according to the irradiance measurements.
2.1 Solar tracking system
This first block includes the system that orients the PV modules in the desired direction. In our study, the solar tracker used has two degrees of freedom, i.e., it can rotate around two different axes. This choice was made because the energy production of a two-axis solar tracker is higher than that of a single-axis one.
In order to compare two different control strategies, two equivalent solar trackers were installed on the SIRTA observatory site [15]. The model of the two solar trackers installed is a dual axis Sun Tracker SM44M1V3P of Sat Control [16].
The two axes around which the tracker can rotate are as follows (Fig. 1):
Primary axis: horizontal East-West axis.
Secondary axis: North-South oblique axis perpendicular to the primary axis, the inclination of the secondary axis depends on the rotation around the primary axis.
B is the angle of rotation of the secondary axis around the primary axis. It is quantified relative to the vertical, hence the secondary axis is horizontal if B = 90°. A is the angle of rotation of the PV module plane around the secondary axis. It is 0° for the south, negative for the east and positive for the west. Due to the limited length of the linear actuators, the angle A can only go up to 50° to the west and −50° to the east, and the angle B can go from 90° to 15°.
Figure 2 shows the two sun trackers (hereafter referred to as T-Cube and T-Chrono) and the radiometric cube installed on a platform at the SIRTA observatory. Each sun tracker is driven by a different control strategy. The T-Cube sun tracker uses the new control strategy developed in this work based on a radiometric cube, and the T-Chrono sun tracker is driven by a standard chronometric sun tracking strategy.
Two identical PV modules from Q-cells model Q.PEAK-G4.1 305 Wp with full cells of silicon technology were installed in the same position (centre) on both trackers. This allows us to compare the energy production of the control strategy from a radiometric cube with a standard chronometric sun tracking strategy.
The PV modules are connected to a variable electronic load which enabled us to measure their current-voltage characteristic I (V) by varying the connected load. It is important to note that the modules do not operate continuously at the maximum power point. An I versus V characteristic is measured every 5 s and the power at the point of maximum power (Pmpp) is deduced. Between two measurements, the PV modules are in open circuit.
The programmable DC electronic load used on the PV module of the T-Cube is the Chroma model 63600 series, and Agilent 6063B is used on the PV module of the T-Chrono. An example of acquisition on the T-Cube PV module is shown in Figure 3. The I (V) curve and the power produced at the point of maximum power (Pmpp) on 06 February 2023 at 14:31:57 UTC are presented.
In order to compensate for the bias due to the differences between the two modules and measurement chains, the powers of the two systems in identical fixed (horizontal) positions were measured over several days (from 3/8/2022 to 21/8/2022). During this period, a series of 8 consecutive cloud-free days was observed. In this comparison, a systematic bias of 2.36% on average (MBE) was found in favour of the T-Chrono power. To compensate this bias, the power of the T-Cube module was corrected in the subsequent analyses by a second-order polynomial regression. This was because the two powers were not perfectly proportional and the trend was better represented by a second order polynomial. Figure 4 shows the result of the comparison between the two PV modules after the correction by the quadratic function. Due to the correction, the systematic error was eliminated and the possible difference of 3% between the modules mentioned in the datasheet was compensated. This allows a good comparison of the Pmpp of the two PV modules driven by two different strategies. However, the limited power range (mainly below 250 W) in which the comparison was performed limits the accuracy we can expect for higher powers. The relative mean absolute error (rMAE) was reduced from 2.71% to 1.27%.
The sun tracker has a micro solar positioner model POZSOL36A1DR, which can be connected directly to a PC (PC-Tracker) via USB. Thus, the movement of the sun tracker can be controlled on the PC-Tracker through LabVIEW software. A LabVIEW program was developed to control the tracker from the measurements of a radiometric cube (see Sect. 3). This new control strategy will be explained in the third part of this article.
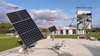 |
Fig. 2 Platform of the two sun trackers (T-Cube and T-Chrono) and the radiometric cube at SIRTA observatory. |
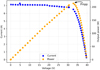 |
Fig. 3 I(V) and P(V) measurement on the module PV. |
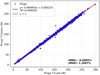 |
Fig. 4 Comparaison of T-Cube and T-Chrono PV modules after correction by the quadratic function. |
2.2 Radiometric cube system
The second block of the system, which represents the novelty we propose, consists of a fixed cube-shaped system on which four irradiance sensors are installed on four of its faces: the east, south, west, and zenith faces. The measurement of the irradiance on these four faces allows the determination of the direction in which the density of the solar radiation is maximum. Thus, it will allow to point a solar tracker to the optimal direction.
The sensors used in this work are SOLEMS model RG100 photodiodes. These are global irradiance sensors based on polycrystalline silicon PV cells with a large field of view with a cosine response correction of less than 1% up to 80° of incidence angle. The bandwidth of the RG100 is [400; 1100 nm] which is well suited to the sensitivity range of crystalline silicon modules. However, these probes measure the photon flux and not the energy flux and thus the measured illuminance depends on the spectral composition of the received radiation. A large field of view and good cosine response are required to obtain the correct luminance value in all areas of the sky to which the sun tracker can be directed. This also limits singularities when direct illumination of a face starts or stops.
The four sensors are named according to their orientation on the cube. RG-E, RG-S, RG-W and RG-Z are the sensors placed on the East, South, West, and Zenith sides of the cube respectively. The radiometric cube is installed on a support made of aluminium alloy on the SIRTA observatory rooftop, where no obstacles could cause shading (Fig. 5).
The RG100 sensor delivers a voltage directly proportional to the irradiance, ranging from 1mV for 10W/m2 V to 100 m V for 1000 W/m2 . The electronic devices used to measure the voltages of the four sensors are a multiplexer with seven analog inputs and one output connected to a KEITHLEY 2000 multimeter. The multiplexer is connected to a NI USB-6008 DAQ to control its switching from a PC (PC-Cube) under LabVIEW software to measure the voltages of the four sensors with a time of 0.3 s for each switch. A KEITHLEY 2000 multimeter is connected to the same PC (PC-Cube) to save and send simultaneously the four irradiance measurements in real-time to the PC-Tracker, which controls the tracker, through wireless UDP data transfer protocol.
Figure 6 shows the principle of the measurements and communication between the radiometric cube system and the solar tracking system. After receiving the irradiances measured on the four faces of the radiometric cube, the PC-Tracker pre-processes the data according to the control strategy explained in the third part of this work to choose the optimal trajectory for the tracking system.
To ensure the accuracy of the four sensors, the latter were calibrated with a high-quality reference global irradiance sensor CMP22 (Kipp & Zonnen) according to the ISO 9847 [17]. An outdoor calibration was performed from the 1st to the 20th of March 2022 for a horizontal calibration under stable cloudless sky conditions. Figure 7 shows the four sensors in a horizontal position with the reference CMP22 during the calibration campaign. Slight inclinations of the sensors were corrected before the calibration. Results after the calibration are presented in Table 1. The bias error after calibration is −0.7% to 0.5% for all four sensors, and the relative mean absolute error (rMAE) is 2.7% to 4.1%, which is below the datasheet limit of 5%. However, a software compensation will be made in a following work to improve the pointing accuracy of the system, as the coordinates of the vector pointing to the Sun depend directly on the sensitivity of the corresponding axis probe.
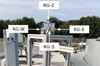 |
Fig. 5 Cube radiometric with the four sensors. |
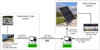 |
Fig. 6 Schematic of the principle of the communication and measurements system. |
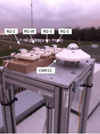 |
Fig. 7 The four RG100 sensors with the CMP22 sensor in a horizontal position during the calibration campaign. |
3 Methodology
3.1 Determination of the optimal direction from the irradiances on a radiometric cube
The principle of the method presented in this paper is based on the mathematical expression of the irradiances on the four faces of the cube. The isotropic model [18], which is simple and commonly used as a baseline for more complex models [19,20], is used for the diffuse luminance of the whole sky. The ground is considered Lambertian with an albedo equal to 0.2. From the mathematical expression of the irradiances of the four faces, it is possible to determine the coordinates of the vector  directed towards the centre of the solar disc as a function of the global solar irradiance on the four faces of the radiometric cube in a direct orthonormal coordinate system (
 ) The optimal direction to increase the collection of the diffuse flux is then deduced.
Figure 8 shows the direct orthonormal coordinate system ( ) and the vector
  directed to the sun position.
  is a horizontal southward unit vector,
  is a horizontal eastward unit vector, and
  is a vertical unit vector pointing to the zenith.
For an isotropic diffuse luminance and a Lambertian ground, the expression of the global irradiance on a plan of array with an inclination β is [18]:
 (1)
(1)
Here, θpoa is the incidence angle of the Sunbeam with respect to the normal of the plan of array. BNI is the direct normal irradiance, DHI is the diffuse horizontal irradiance, GHI is the global horizontal irradiance and ρ is the reflectivity coefficient (albedo) of the ground.
– Following equation (1), the irradiance on the South face of the radiometric cube is:
 (2)
(2)
the inclination with respect to the horizontal being 90°. This expression is valid between the spring equinox and autumn equinox, and after the sun passes the azimuth −90° (East direction) in the morning and before it passed the azimuth +90° (West direction). Otherwise, the South face of the radiometric cube does not receive direct irradiance, and the expression becomes:
 (3)
(3)
In the morning before the sun crossed the local meridian (azimuth 0°), the irradiance on the East face of the radiometric cube is:
 (4)
(4)
otherwise:

, the same as in equation (3)
The irradiance on the West face, in the afternoon after the sun passed the azimuth 0° (south direction), is:
 (5)
(5)
otherwise:
 (6)
(6)
The irradiance on the Zenith face of the radiometric cube is without the reflected radiation from the ground:
 (7)
(7)
According to equations (4), (5) and (6), the following equation is valid all the time:
 (8)
(8)
which means that IE − IW is the component of the projection of  along
along  axis BNI being the norm of
  (the cosine is negative when IW > IE, which occurs when the Sun has crossed the local meridian plane). According to equations (2) and (3), when the sun is in the southern half of the celestial vault:
 (9)
(9)
otherwise, IS − Imin = 0, but the solar tracker cannot be tilted to the north, so it is not necessary to consider this case (where cos(θS) is negative). In these situations, the B angle is set to 90°. According to equation (9), IS − Imin is the component of the projection of  along the
  axis.
axis.
By noting that the illuminance of the vertical faces due to the reflection on the ground is small compared to the diffuse illuminance due to the sky vault, we can make the approximation:

This leads to an overestimation of DHI, which in turn leads to an underestimation of cos (θZ).
 (10)
(10)
This is what we did as a first approximation in this work.
A better approximation would be: DHI = 2IW − ρIZ in the morning and DHI = 2IE − ρIZ in the afternoon. ρ, the reflectivity of the ground, being an unknown, which can be set to 0.2 as a first approximation and then adjusted experimentally by minimising the average difference between the theoretical direction of the sun and that evaluated by the radiometric cube. This leads to a more precise expression of the vector pointing to the sun.
The coordinates of the vector  on the (
 ) coordinate system can finally be expressed as a function of the irradiances on the four faces of the radiometric cube:
 (11)
(11)


The magnitude of the vector  is equal to BNI.
However, this vector does not indicate the direction in which the total radiation flux density is maximum. In fact, to increase the collection of diffuse irradiances, a direction closer to the zenith is preferable. To a first approximation it is given by the vector  :
:
 (12)
(12)


In order to align the tracker in this direction, the coordinates of the unit vector  , which is the unit vector normal to the plane of the PV modules on the tracker, must be known as a function of the A and B angles of the tracker.
Figure 9 shows the vector  , A and B angles on the coordinate system (
 ). The orthogonal projection of
  on the plane (
 ) is the vector
  with cos(A) as a magnitude. The projection of
  on
on  axis is
  as the angle between
  and
and  is equal to B. The projection of
  on
on  axis is
  , which is the component of
  on
on  axis.
axis.  is the projection of
  on
on  axis with negative sign as A is negative to the East. So, the expression of
  on the coordinate system (
 is:
is:
 (13)
(13)
In order to point the solar tracker in the direction of  ,
,  should be colinear to
  . By normalizing
  to
to  , the coordinate of
  can be made equal to the coordinate of
  . This allows the determination of A and B angles that direct the solar tracker towards the optimal direction in function of the irradiances of the four faces of the radiometric cube.
 (14)
(14)


According to equations above:
 (15)
(15)
– The denominator IS − Imin of B angle should not be equal to 0. This denominator is different from 0 during the period between the autumn equinox and spring equinox, and when the sun passed the azimuth −90° (East direction) in the morning and before it passed the azimuth +90° (West direction).
– During the period when IS − Imin is equal to 0, the angle B will be set equal to 90° which is equal to arctan (+ ∞), which means that the secondary axis NS is in a horizontal position. This will allow the A angle to point the tracker to the East direction in the morning before the sun passed the −90°azimuth and to the west direction in the evening after the sun passed the 90° azimuth. If the weather condition is completely diffuse during this period, the tracker will be in the horizontal position, as B angle is equal to 90° and IE = IW = Imin, so A will be equal to 0°.
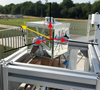 |
Fig. 8 The direct orthonormal coordinate system |


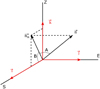 |
Fig. 9 The vector |


3.2 Algorithm for the optimal direction
Equation (15) gives the A and B angles that direct the solar tracker towards the optimal direction in function of the four irradiances on the radiometric cube. A LabVIEW program was implemented on the PC-Tracker to drive the solar tracker towards this optimal direction using equation (15).
In order to determine Imin in the LabVIEW program, IE and IW are compared. Indeed, according to the hypothesis of uniform luminance of the celestial vault and Lambertian ground, IW = Imin during the morning before the sun passed its maximum height in azimuth 0° (towards the South) and IE = Imin in the afternoon if the meteorological condition is not totally overcast.
Figure 10 shows the flowchart of the algorithm for controlling the T-Cube tracker from the radiometric cube. This algorithm is implemented on the PC-Tracker. The first step is to receive the four irradiances measured on the radiometric cube during 5 min. The time step of the irradiance acquisitions is 5 s. Thus, the data received during 5 min corresponds to 60 measurements of the four irradiances. Then the last 2 min of measurements of IE, IZ, IW and IS (36 measurements each) are averaged  . These averages are then used to determine
  and calculate the set points of A and B angles using equation (15). The average of the measurements of the last 2 min was used to exploit the information of the latest variation of the solar irradiance on the PV module. Considering the values measured during the 5 min would be more relevant by applying a weighted average with a high coefficient on the last measurements. In the present work, an average of the last 2 min was used. When A and B angles are calculated, the actuators are activated to direct the PV modules towards the set angles. Once the PV modules are pointed in the direction of the vector
  , the program returns to the reception of the irradiances for 5 min, which also corresponds to the waiting time between movement of the T-Cube. When the PV modules are directed to the direction of the vector
  , the program returns to the reception of the irradiances for 5 min, which also corresponds to the time between the movement of the T-Cube.
4 Results and discussions
The control strategy presented in this paper has been tested at the SIRTA observatory site (Palaiseau, France) located at 48.717607° N latitude and 2.209002° E longitude. The T-Cube sun tracker, controlled by the radiometric cube using the algorithm in the Figure 10, was compared with an identical two-axis sun tracker T-Chrono controlled by a standard sun tracking strategy integrated by its manufacturer.
The energy gain by T-Cube is calculated by
 (16)
(16)
where

ET_Cube is the energy produced by T-Cube and ET_Chrono is the energy produced by T-Chrono in a given period between and t0 and t1.
Figure 11 shows the comparison of the Pmpp produced by the two trackers during a day that had three periods with different weather conditions (sunny, cloudy, very variable). The “diffuse fraction” is the ratio of horizontal diffuse irradiance to global horizontal irradiance. (DHI/GHI) is also plotted on the same figure in order to know the level of cloud cover in the sky during the day. The higher this indicator is, the closer it is to 1, the greater the cloud cover. Conversely, when the diffuse fraction is close to 0, the sky is very clear. The DHI and GHI measurements used in our study come from a radiometric station at SIRTA observatory. Figure 12 shows the movement of the two sun trackers on the same day (12 October 2022). Figure 12 a shows the evolution of the inclination (with respect to the horizontal) of the two trackers and the zenith angle of the Sun. Figure 12 b shows the evolution of the azimuth of the two trackers and the solar azimuth on the same day (12 October 2022). The NREL solar position algorithm model [21] was used to determine these solar coordinates.
On 12 October 2022, Figure 12 shows that the inclination and azimuth of the T-Chrono follow the zenith angle and solar azimuth perfectly during the period of clear sky when the mechanical limits of the solar tracker allowed it to follow the sun. This movement of the T-Chrono during periods of clear sky confirms that the T-Chrono's control algorithm is correctly tracking the sun.
Between 7 am and 10:20 am, the diffuse fraction diminishes and remains always less than 0.5, indicating a period of clear sky. Figure 12 shows that T-Cube also follows the path of the sun but with a very slight over-tilt which may have caused a small loss compared to T-Chrono. Nevertheless, the loss is only a 0.15% difference in the energy produced by T-Cube and T-Chrono during this clear sky period. This apparent loss remains within the order of magnitude of the uncertainty of the power correction applied to the cube-driven system. The performance of the two control strategies is therefore equivalent. The slight over-tilt may have been caused by the high reflectivity of the metal frame of the cube. During periods of clear sky, the direct radiation from the sun is the dominant component of the irradiance on the PV module. Therefore, the tracker maximises the energy produced by following the path of the sun. Referring to the literature [22,23], the chronometric sun tracking provides a gain of 26.9–30.2% compared to a fixed PV system during clear sky periods.
Between 10:20 a.m. and 12:10 p.m, the diffuse fraction is equal to 1, indicating an overcast period without direct irradiance. Figure 12 shows that T-Cube reduces its inclination to take advantage of the diffuse irradiance while T-Chrono continues to follow the sun. During an overcast period, the irradiance is mainly due to the scattered solar radiation from the sky vault. In this situation, the isotropic model, where the radiation has the same intensity in all directions of the vault, is a very good approximation. In such a situation, the best position for the sun tracker would be to reduce its inclination to increase its field of view of the sky to take advantage of maximum diffuse irradiance. Figure 11 shows that during the cloudy period, the Pmpp produced by T-Cube is always higher than that Pmpp produced by T-Chrono. There is a 12.7% gain in energy produced by T-Cube compared to T-Chrono during this period. This demonstrates a good behaviour of the control strategy from the radiometric cube during a cloudy period.
During the period after 12:10 pm, there is a strong variation of the diffuse fraction. This indicates a period of strong weather variation. T-Chrono continues to follow the sun. During the peaks of the diffuse fraction towards 1, the T-Cube decreases its inclination to benefit from the diffuse radiation. Conversely, T-Cube aims to move closer to the Sun's position as the DHI/GHI ratio decreases to a minimum. This minimum means that the sun is visible for a short period and then the direct irradiance dominates. As T-Chrono is always facing the sun, it receives the maximum of direct irradiance during this period compared to T-Cube which is late to be at the sun's position. On the other hand, during peaks of the diffuse fraction, the T-Cube produced the highest Pmpp. During this period of high weather variability, the difference in the energy produced by the two trackers is only 1Wh, a difference of 1%.
Figure 13 shows the comparison of the two trackers during a fully diffuse day with a diffuse ratio equal to 1 all day. T-Chrono was always in sun-tracking mode. The movement of T-Cube during this day was always close to horizontal to take advantage of the diffuse irradiance. Figure 13 shows that the Pmpp of T-Cube was always higher than the Pmpp of T-Chrono for the vast majority of the time. On this fully diffuse day, the radiometric cube control strategy has led to a 40.5% increase in energy production comparing to the control that followed the sun. In the literature, Quesada et al. [24] compared a two-axis sun tracker using a chronometric sun tracking with a fixed horizontal PV system oriented towards the zenith on cloudy days and at high latitudes. Their experience revealed that by following the sun, the PV module produces up to 25% less energy than in a horizontal position. Compared to the control strategy presented in this paper, the latter produced a 40.5% energy gain compared to chronometric tracking. This is due to the fact that the T-cube was not always in a horizontal position but was tilted slightly to take advantage of the radiation from the circumsolar system.
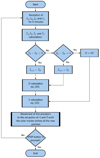 |
Fig. 10 Flowchart of the algorithm to control the sun tracker from the radiometric cube. |
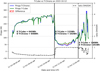 |
Fig. 11 Comparison of the Pmpp produced by T-Cube and T-Chrono on 12 October 2022. |
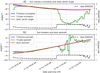 |
Fig. 12 Comparison of the movement of the two trackers and the sun's path during the day on 12 October 2022. |
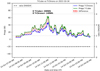 |
Fig. 13 Comparison of the Pmpp produced by T-Cube and T-Chrono on 14 October 2022. |
5 Conclusion
In this paper, a new control strategy for a dual-axis sun tracker from a radiometric cube has been presented and compared experimentally with standard chronometric sun tracking. From the mathematical expression of the irradiance on the four faces of the radiometric cube (i.e., east, west, south, and zenith) considering that the luminance of the sky vault is uniform (except in the circumsolar region), the optimal orientation of the solar tracker is determined. This optimal orientation enables the sun tracker to adjust its position to receive the maximum radiation per unit area in all meteorological conditions.
The results showed that during clear sky periods, the radiometric cube control becomes like a standard chronometric sun tracking, following the sun's path with a slight over-tilt probably due to high soil reflectivity in the vicinity of the cube in its actual setting. In such weather condition, the best position is to face the sun to take advantage of the direct radiation. The small over-tilt might also be due to the differences of the RG 100 probes, especially the RG-Z, which has a larger negative bias comparing to the others, which leads to an underestimation of the irradiance towards the zenith. However, there is only a 0.15% difference between the energy produced by the control from the radiometric cube and the standard chronometric sun tracking. The results showed that the proposed new control strategy achieves a significant gain of 40.5% for a cloudy day. For a period of highly variable weather conditions, the control from the radiometric cube adjusts the position of the sun tracker to maximise the irradiance that the sun tracker received. However, it was found that there is a time delay for the sun tracker to face the sun when the sun shows up for a short period, resulting in a slight loss of energy output of 1% compared to chronometric tracking. One way to improve this control strategy is to reduce the time delay between two movements of the sun tracker to allow a faster time-response of the sun tracker to be more efficient for highly variable periods. The acceleration of the response could be achieved automatically in periods of high variation. Another way to improve this control strategy is to correct the hypothesis of a uniform celestial vault and Lambertian ground using a machine learning approach that takes into account the local environment.
Results after the calibration of the four sensors.
Author contribution statement
The work presented in this paper is the result of equal contributions from all authors.
Nomenclature
PV: Photovoltaic
EW: East-West
NS: North-South
MBE: Mean bias error (W/m2)
rMBE: Relative mean bias error (%)
MAE: Mean absolute error (W/m2)
rMAE: Relative mean absolute error (%)
PC-Cube: PC used for the acquisition of the four irradiances on the radiometric cube
PC-Tracker: PC used to control the solar tracker
A angle: Rotation angle of the PV module plane around the secondary axis of the solar tracker
B angle: Rotation angle of the secondary axis around the primary axis of the solar tracker
ET_chrono: Energy produced by the solar tracker T-Chrono during a given time
ET_cube: Energy produced by the solar tracker T-Cube during a given time
Is: Irradiance on the south face of the radiometric cube
Iz: Irradiance on the zenith face of the radiometric cube
IE: Irradiance on the East face of the radiometric cube
IW: Irradiance on the West face of the radiometric cube
 : Average of 36 measurements (during 2 min) of IS
 : Average of 36 measurements (during 2 min) of IZ
 : Average of 36 measurements (during 2 min) of IE
 : Average of 36 measurements (during 2 min) of IW
Imin: Minimum between IE and IW
β: Inclination of a plan of array
 : Horizontal unit vector directed to the South
 : Horizontal unit vector directed to the East
 : Vertical unit vector directed to the Zenith
 : Vector directed to the center of the disc of the sun
 : Vector with the optimal direction
 :
:  normalized
 : Unit vector normal to the plane of the PV modules on the tracker
 : Orthogonal projection of on the plane
θs: Incidence angle of the direct irradiance with respect to South direction
θE: Incidence angle of the direct irradiance with respect to East direction
θw: Incidence angle of the direct irradiance with respect to West direction
θz: Incidence angle of the direct irradiance with respect to Zenith direction
BNI: Beam or direct normal irradiance (W/m2)
DHI: diffuse horizontal irradiance (W/m2)
GHI: Global horizontal irradiance (W/m2)
I: Current (A)
V: Voltage (V)
I(V): I versus V curve
ρ: Albedo of the ground
Acknowledgments
The authors would like to express a sincere gratitude to the LabEx LaSIPS (ANR-10-LABX-0032-LaSIPS) managed by the French National Research Agency under the “Investissements d'avenir” program (ANR-11-IDEX-0003) for their financial support. The authors would also like to thank the 3rd Programme d'Investissements d'Avenir [ANR-18-EUR-0006-02] and the Foundation of Ecole polytechnique (Chaire “Défis Technologiques pour une Énergie Responsable” financed by TotalEnergies) for their support in this work.
References
- V. Masson-Delmotte, P. Zhai, A. Pirani, S.L. Connors, C. Péan, S. Berger, N. Caud, Y. Chen, L. Goldfarb, M.I. Gomis, M. Huang, K. Leitzell, E. Lonnoy, J.B.R. Matthews, T.K. Maycock, T. Waterfield, Ö. Yelekçi, R. Yu, B. Zhou (Eds.), Climate change 2021: the physical science basis. contribution of working group i to the sixth assessment report of the intergovernmental panel on climate change (Cambridge University Press, 2021) [Google Scholar]
- H.-O. Pörtner, D.C. Roberts, M.M.B. Tignor, E.S. Poloczanska, K. Mintenbeck, A. Alegría, M. Craig, S. Langsdorf, S. Löschke, V. Möller, A. Okem, B. Rama (Eds.), Climate change 2022: impacts, adaptation and vulnerability. Contribution of working group ii to the sixth assessment report of the intergovernmental panel on climate change (Cambridge University Press, 2022) [Google Scholar]
- P.R. Shukla, J. Skea, R. Slade, A. Al Khourdajie, R. van Diemen, D. McCollum, M. Pathak, S. Some, P. Vyas, R. Fradera, M. Belkacemi, A. Hasija, G. Lisboa, S. Luz, J. Malley (Eds.), Climate change 2022: mitigation of climate change. Contribution of working group iii to the sixth assessment report of the intergovernmental panel on climate change (Cambridge University Press, 2022) [Google Scholar]
- Md. R. Haider, A. Shufian, Md. N. Alam, M.I. Hossain, R. Islam, Md. A. Azim, Design and implementation of three-axis solar tracking system with high efficiency, in: 2021 International Conference on Information and Communication Technology for Sustainable Development (ICICT4SD), 2021, pp. 1. [Google Scholar]
- W. Nsengiyumva, S.G. Chen, L. Hu, X. Chen, Recent advancements and challenges in solar tracking systems (STS): a review, Renew. Sust. Energ. Rev. 81, 250 (2018) [CrossRef] [Google Scholar]
- Y. Rizal, S.H. Wibowo, Feriyadi, Application of solar position algorithm for Sun-tracking system, Energy Procedia 32, 160 (2013) [CrossRef] [Google Scholar]
- R. Eke, A. Senturk, Performance comparison of a double-axis sun tracking versus fixed PV system, Sol. Energy 86, 2665 (2012) [CrossRef] [Google Scholar]
- Y. Yao, Y. Hu, S. Gao, G. Yang, J. Du, A multipurpose dual-axis solar tracker with two tracking strategies, Renew. Energy 72, 88 (2014) [CrossRef] [Google Scholar]
- Y. Sai, R. Ma, X. Yang, Design and analysis of a Sun tracking system, in: G. Shen, X. Huang (Eds.), Advanced Research on Computer Science and Information Engineering, Communications in Computer and Information Science (Springer, 2011), pp. 8 [CrossRef] [Google Scholar]
- M. Burhan, S.J. Oh, K.J.E. Chua, K.C. Ng, Double lens collimator solar feedback sensor and master slave configuration: development of compact and low cost two axis solar tracking system for CPV applications, Sol. Energy 137, 352 (2016) [CrossRef] [Google Scholar]
- R.F. Fuentes-Morales, A. Diaz-Ponce, M.I. Peña-Cruz, P.M. Rodrigo, L.M. Valentín-Coronado, F. Martell-Chavez, C.A. Pineda-Arellano, Control algorithms applied to active solar tracking systems: a review, Sol. Energy 212, 203 (2020) [CrossRef] [Google Scholar]
- H. Fathabadi, Novel high accurate sensor less dual-axis solar tracking system controlled by maximum power point tracking unit of photovoltaic systems, Appl. Energy 173, 448 (2016) [CrossRef] [Google Scholar]
- R. Ahmed, S.J. Oh, M.U. Mehmood, Y. Kim, G. Jeon, H.J. Han, S.H. Lim, Computer vision and photosensor based hybrid control strategy for a two-axis solar tracker − daylighting application, Sol. Energy 224, 175 (2021) [CrossRef] [Google Scholar]
- D.A. Flores-Hernández, S. Palomino-Resendiz, N. Lozada-Castillo, A. Luviano-Juárez, I. Chairez, Mechatronic design and implementation of a two axes sun tracking photovoltaic system driven by a robotic sensor, Mechatronics 47, 148 (2017) [CrossRef] [Google Scholar]
- M. Haeffelin, L. Barthès, O. Bock, C. Boitel, S. Bony, D. Bouniol, H. Chepfer, M. Chiriaco, J. Cuesta, J. Delanoë, P. Drobinski, J.-L. Dufresne, C. Flamant, M. Grall, A. Hodzic, F. Hourdin, F. Lapouge, Y. Lemaître, A. Mathieu, Y. Morille,C. Naud, V. Noël, W. O'Hirok, J. Pelon, C. Pietras, A. Protat, B. Romand,G. Scialom, R. Vautard, SIRTA, a ground-based atmospheric observatory for cloud and aerosol research, Ann. Geophys. 23, 253 (2005) [CrossRef] [Google Scholar]
- Sat Control d.o.o., https://solar-motors.com/product/solar-tracker-2-axis-st44m2v3p-w-backstr-for-3-pan-0121-st44m2v3p-without-main-pole-and-ground-screws/?v=11aedd0e4327 [Google Scholar]
- International Organisation for Standardization (ISO), Solar energy – Calibration of field pyranometers by comparison to a reference pyranometer. ISO 9847:1992 (1992) [Google Scholar]
- B. Liu, R. Jordan, Daily insolation on surfaces tilted towards equator, ASHRAE J. (United States) 10, 53 (1961) [Google Scholar]
- J.A. Davies, J.E. Hay, Calculation of the solar radiation incident on a horizontal surface, in: Proc. First Can. Solar Radiation Data Workshop. Ministry of Supply and Services, Canada, 1980, pp. 32 [Google Scholar]
- R.C. Temps, K.L. Coulson, Solar radiation incident upon slopes of different orientations, Sol. Energy 19, 179 (1977) [CrossRef] [Google Scholar]
- I. Reda, A. Andreas, Solar position algorithm for solar radiation applications, Sol. Energy 76, 577 (2004) [CrossRef] [Google Scholar]
- M.H.M. Sidek, N. Azis, W.Z.W. Hasan, M.Z.A. Ab Kadir, S. Shafie, M.A.M. Radzi, Automated positioning dual-axis solar tracking system with precision elevation and azimuth angle control, Energy 124, 160 (2017) [CrossRef] [Google Scholar]
- H. Fathabadi, Novel high efficient offline sensor less dual-axis solar tracker for using in photovoltaic systems and solar concentrators, Renew. Energy 95, 485 (2016) [CrossRef] [Google Scholar]
- G. Quesada, L. Guillon, D.R. Rousse, M. Mehrtash, Y. Dutil, P.-L. Paradis, Tracking strategy for photovoltaic solar systems in high latitudes, Energy Convers. Manag. 103, 147 (2015) [CrossRef] [Google Scholar]
Cite this article as: Mahery H. Andriamahefa, Vincent Bourdin, Xavier Mininger, Jordi Badosa, Johan Parra, Anne Migan-Dubois, Control strategy for a dual-axis sun tracker based on a radiometric cube to maximize the power output of the PV system, EPJ Photovoltaics 14, 35 (2023)
All Tables
All Figures
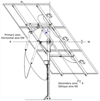 |
Fig. 1 The two axis of the solar tracker [16]. |
| In the text | |
|
Fig. 2 Platform of the two sun trackers (T-Cube and T-Chrono) and the radiometric cube at SIRTA observatory. |
| In the text | |
|
Fig. 3 I(V) and P(V) measurement on the module PV. |
| In the text | |
|
Fig. 4 Comparaison of T-Cube and T-Chrono PV modules after correction by the quadratic function. |
| In the text | |
|
Fig. 5 Cube radiometric with the four sensors. |
| In the text | |
|
Fig. 6 Schematic of the principle of the communication and measurements system. |
| In the text | |
|
Fig. 7 The four RG100 sensors with the CMP22 sensor in a horizontal position during the calibration campaign. |
| In the text | |
|
Fig. 8 The direct orthonormal coordinate system |
| In the text | |
|
Fig. 9 The vector |
| In the text | |
|
Fig. 10 Flowchart of the algorithm to control the sun tracker from the radiometric cube. |
| In the text | |
|
Fig. 11 Comparison of the Pmpp produced by T-Cube and T-Chrono on 12 October 2022. |
| In the text | |
|
Fig. 12 Comparison of the movement of the two trackers and the sun's path during the day on 12 October 2022. |
| In the text | |
|
Fig. 13 Comparison of the Pmpp produced by T-Cube and T-Chrono on 14 October 2022. |
| In the text | |
Current usage metrics show cumulative count of Article Views (full-text article views including HTML views, PDF and ePub downloads, according to the available data) and Abstracts Views on Vision4Press platform.
Data correspond to usage on the plateform after 2015. The current usage metrics is available 48-96 hours after online publication and is updated daily on week days.
Initial download of the metrics may take a while.